Oceanic and Atmospheric Circulation
Laboratory Exercise 1
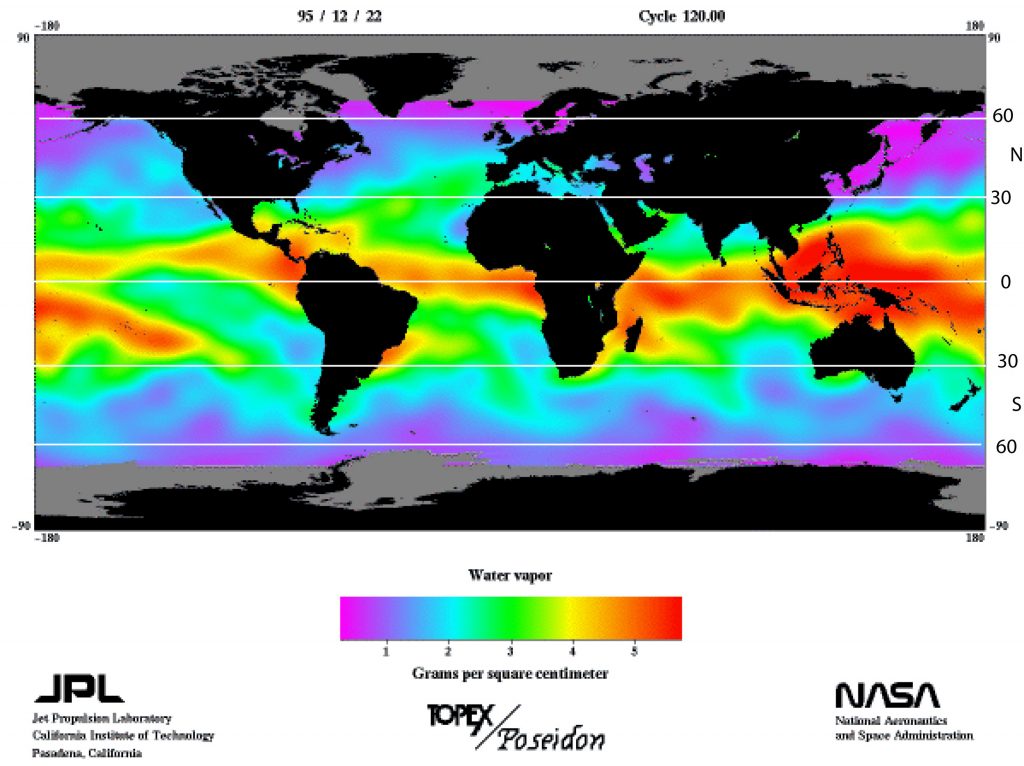
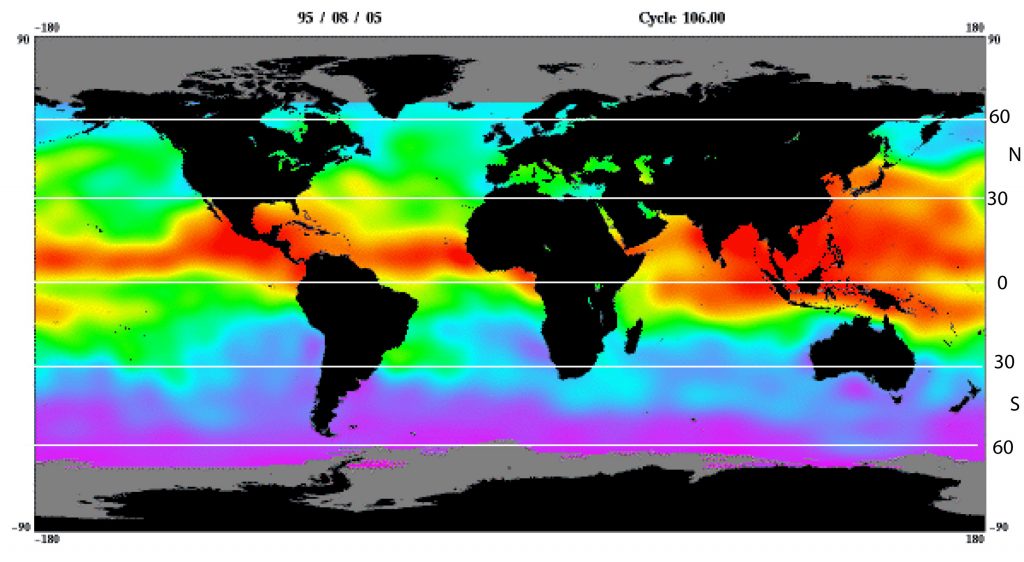
Water Vapor Images
Upper image: Data from 22 December 1995 (Northern Hemisphere Winter)
Lower Image: Data from 5 August 1995 (Northern Hemisphere Summer)
Scale at bottom of images in grams per square centimeter (1-5)
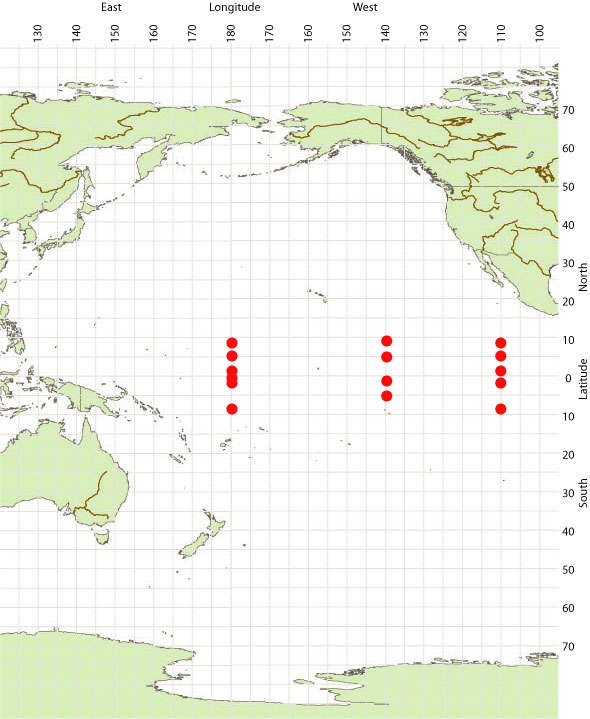
Global Buoys Map
Global Sea Surface Temperature map:
Sea surface temperature for the entire world ocean in August 1995. Temperatures are in degrees Celsius
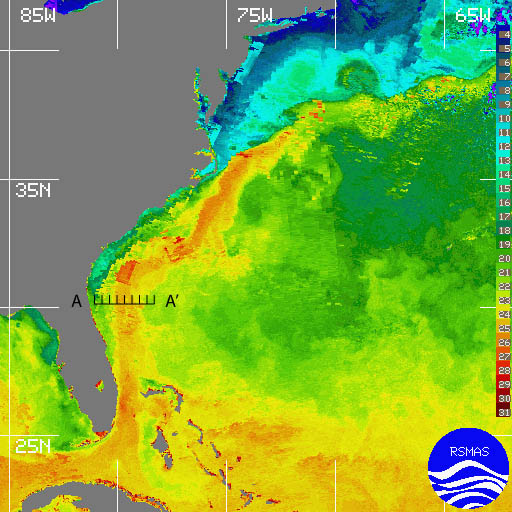
Gulf Stream Current Images
Data from 25 February 1996, Sea surface temperature in degrees Celcius
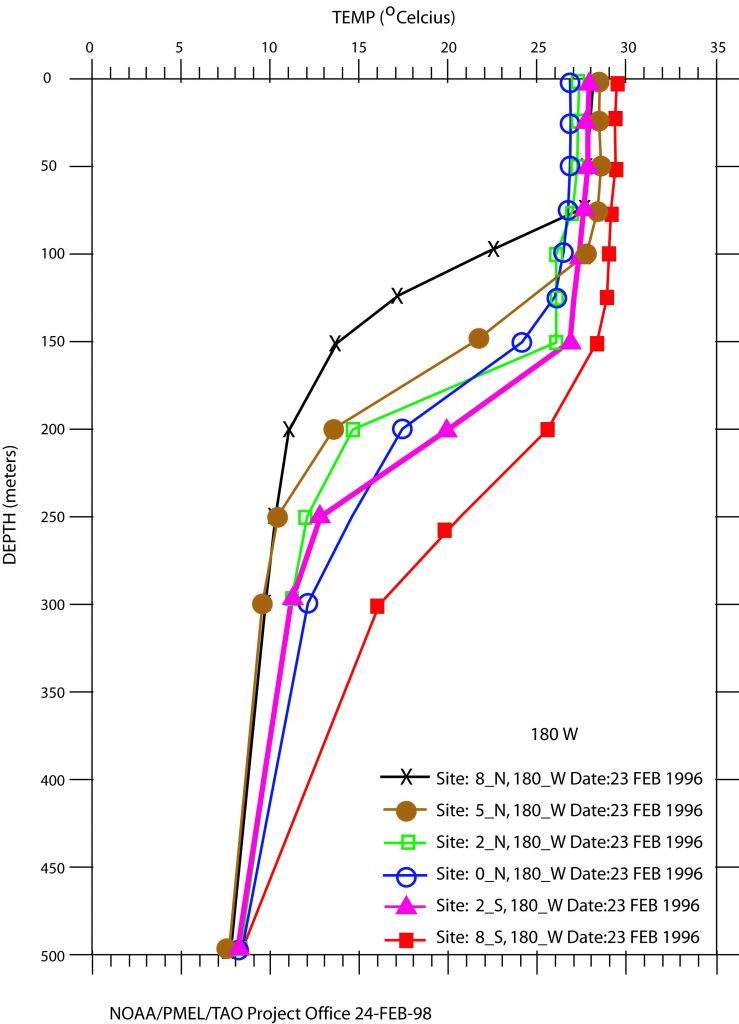
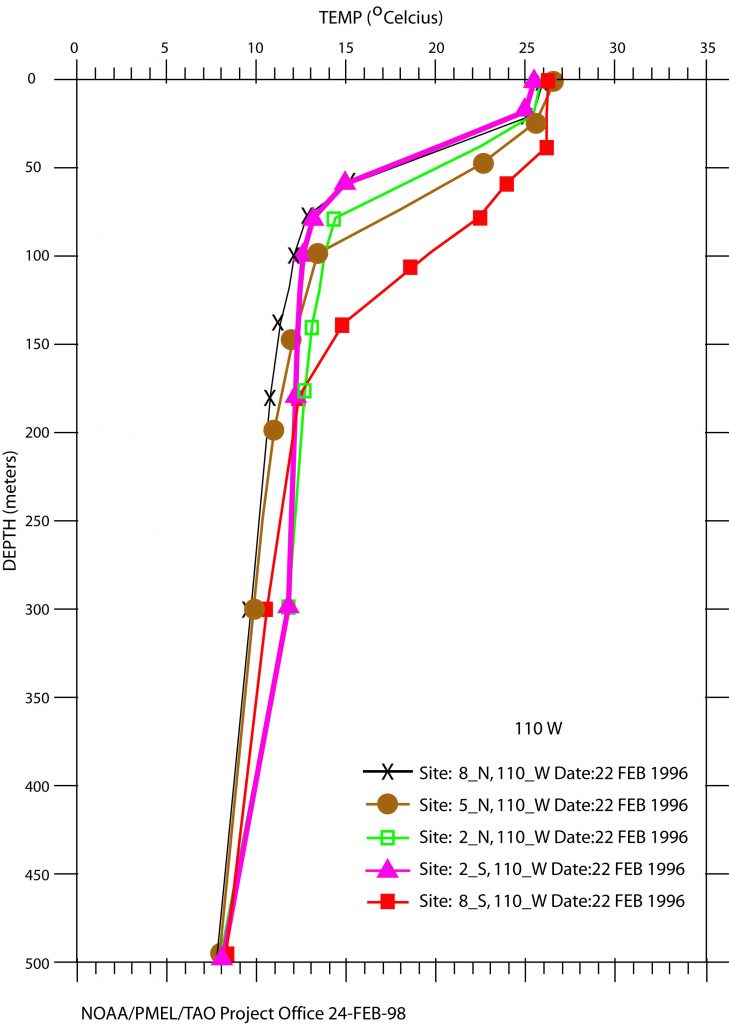
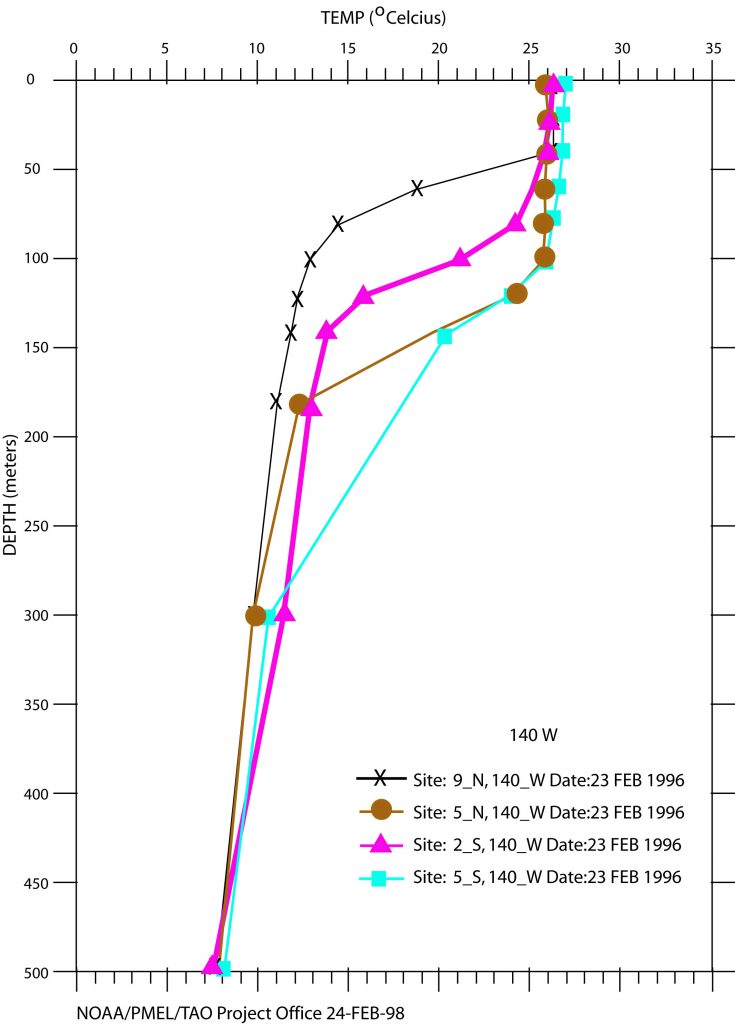
Vertical Structure of the Ocean
110 WEST
140 WEST
180 WEST